🧵 View Thread
🧵 Thread (32 tweets)

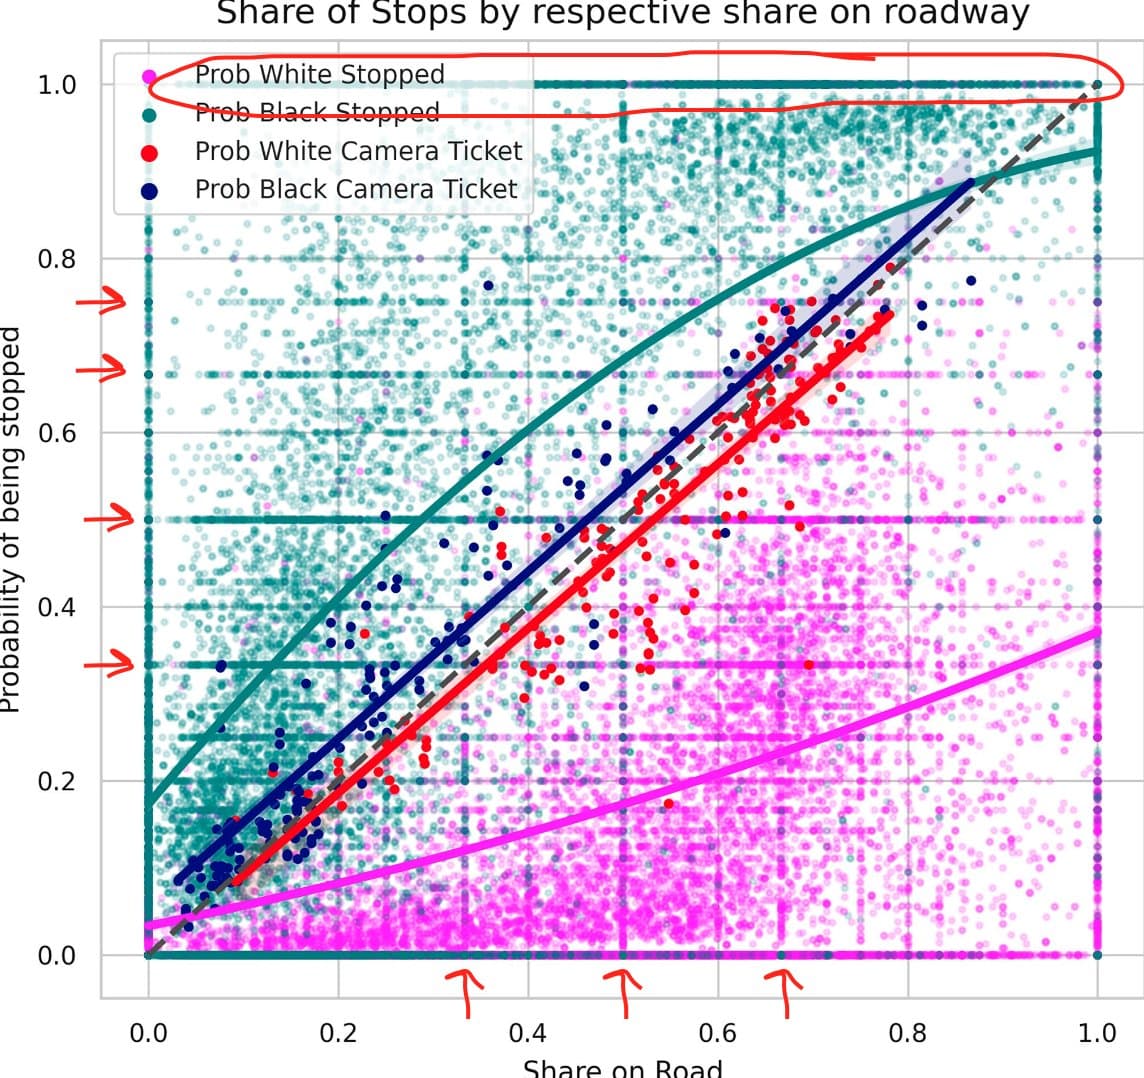
this is an interesting image. let's see whats going on under the hood. https://t.co/JmiQYBmGT1
the figure appears to show that 1. camera tickets are distributed to whites and blacks roughly in proportion to their share on the road 2. blacks are stopped more than proportionately, and whites less than proportionately, to their driver share
taken at face value, one imagines an argument forming along the following lines: * by an "objective" measure of one feature of illegal driving, whites and blacks have similar behaviors as a group * this is some evidence that traffic stops are racially discriminatory
the obvious rebuttal to this is that most people who get nailed by a traffic camera do not do so in such a way as to get stopped by police, and probably other factors that do differ by race might be explanatory but we'll get to that i expect
meanwhile two features of the image make me nervous 1. i don't know how the lines in this figure were generated, but at least by ocular regression one might expect them to come out looking more like this. so what's up with that https://t.co/E4oI32WUV4

2. there are a bunch of weird irregularities in the distribution of traffic stop data points. specifically, * odd horizontal and vertical clusters (arrows), suggesting the data might be eg censored or just shitty * tons of 0% or 100% stop shares (circled), also sus https://t.co/buHarYpC17
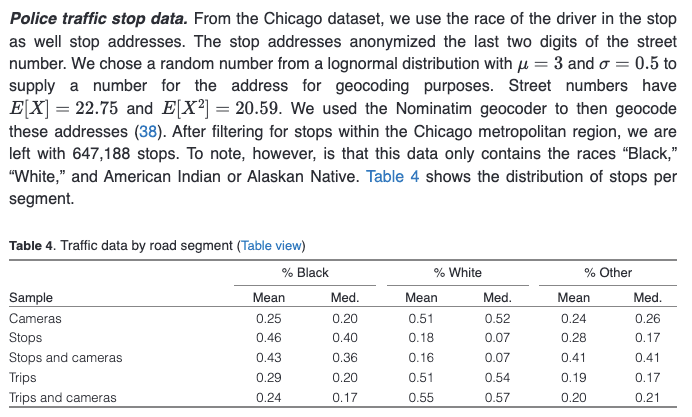
actually getting into the paper, we get this for a high level introduction to methods the important first thing to note is that this is a study about traffic stops IN CHICAGOANS. does this generalize to other cities? idk https://t.co/osLppzmveU

and now we come to what on a first pass is a crippling issue: the race of people to whom camera tickets are given is NOT OBSERVED instead, they're roughly proportionately _assigned_ a race based on the racial demographics of the census tract in which a vehicle is registered https://t.co/gkalYwqIOA

this strikes me as just terrible frankly lotta ways to rotate this, but the implicit assumption is that traffic tickets issued by camera to members of a given census tract are distributed uniformly across races weighted by % composition roughly, they're assuming the conclusion
here's the traffic composition dataset description. it's possibly proprietary but in any case a highly processed data product i'm happy to accept it as reasonable on a first pass. i won't go to the mat for it but there's not obviously directional bias to the results baked in https://t.co/aZgKOXBNXG

police stop data, they do some geocoding that seems benign note though that throughout the paper "white" includes "hispanic." using "white" in this way is technically correct but somewhat misleading note that ~51% of drivers are white and chicago (proper?) is ~30% hispanic https://t.co/cpkll6sVjv
we're not all clear on the interpretability of police data though, at least in this context. because lol it turns out these data are a mess for the purpose of their regression basically, the vast bulk of stops take place in a few concentrated areas https://t.co/Cgf4YEgBhq

this is somewhat problematic because their Big Regression is carried out at the road segment level and practically all segments have few or no stops so we're trying to make some heroic inferences off a few outliers, mostly? my intuition for negative binomial regression is thin https://t.co/15dyTiGWss

these data are standardized (presumably z-scored?), which helpfully makes coefficient interpretability more straightforward looking at the coefficients, it's striking to me that population density has an effect of ~50x that of %black drivers on # black stops in a segment
looping back to this thing, i assume the fit lines are somehow derived from regression models, although they might use a different approach it's really hard to tell tbh regardless, police stop data issues and a blah model explain my earlier complaints https://t.co/5BsakevNQ9

hypothesis (confusingly) one: camera traffic citations are "race neutral" verdict: ok first of all "race-neutral" is an awful framing. "race-neutrality" could mean "all" races have P(ticket) or it could mean that all races have the same P(ticket|driving) https://t.co/HfrssUcxAR
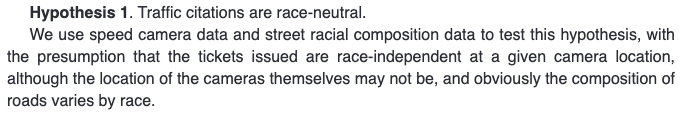
in this case though only the P(ticket) = P(ticket|race) hypothesis is considered. make of that what you will. the authors (surprisingly?) reject this because actually when you squint blacks are 30% more likely to get tickets than reference pop while whites, 5% _less_ likely https://t.co/vRz80idAh1

so i guess we conclude that traffic cameras are racist? apparently more and more are saying this what a victory for @ibramxk https://t.co/7Q7sHxZvXp

@ibramxk all right so using incredibly questionable inferred race labels for camera-based traffic citations that i would have been expected to produce a null result by construction we still "find" that black ppl somehow trigger disproportionate traffic citations from cameras what a world
@ibramxk hypothesis two: police stops are race neutral here using the same questionable notion of race neutrality as above accepting the framing, same results natch. this is in fact pretty obvious from the plotted data https://t.co/diZHrrdpcP

@ibramxk hypothesis three: police stops are no more racially discriminatory than camera stops. and here we leap from "race neutrality" to "racial discrimination," or at least to _acts_ of racial discrimination no explicit statistical test? sure, the proportions are different here, idc https://t.co/B1af60pMNT

@ibramxk overall comments: this paper was a waste of my time and yours. the "hypotheses" it "tests" could have been completed without any "machine learning" techniques like the regression. summary data wouldve been enough the "questions" encoded in the hypotheses were "dreck"
@ibramxk the paper does none of the things it claims to in the first image. it's philosophically barren. it is puerile. it is embarrassing. i am astonished that seven authors and an editor were necessary to produce it, and that they were willing to use what i assume are their real names https://t.co/8uahPthQDd

the authors use words in off-key nonstandard ways and can't, or won't, keep track of their arguments. a majority of the paper is filler. they use "data" in the singular case. they can't be bothered to capitalize their axis titles properly and they obscure data with their legend https://t.co/3xNaIsDjee

the introduction reads as if one of the chinese students, i assume a graduate, was taken into a back room by DEI goons and threatened with a lead role in a revival of the cultural revolution unless he extruded a mindless lit review section can you feel him trying to care https://t.co/LTQQwtvrrl

one might try to peg the status of an industry by the class markers of its letters. this paper strikes me as middle class in its euphemism and prole in its flailing struggles with language. it is a sell signal for academic prestige https://t.co/Q58s9PuFwa
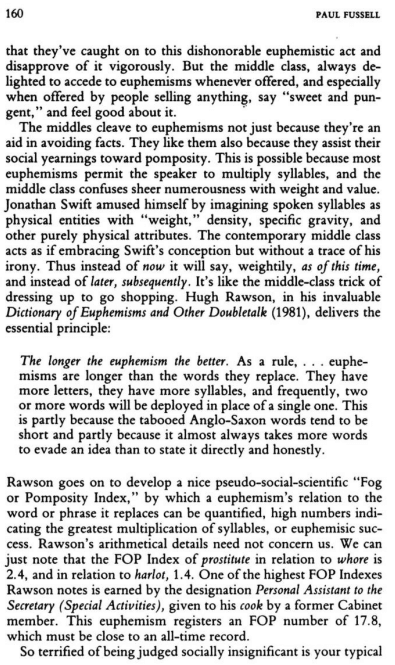
more generally this paper displays a stunning decline in raw literary quality from the standard set by, i don't know, let's randomly pick john milton and they're not even trying. there's no care of composition nor thought here. it's slop.
overall Xu et al (2024) raises anew the question i have for everyone in academia, and i hope it encourages further participation in my own favored line of inquiry. it does not however make any other contributions. desk reject https://t.co/gzQBUeqeeC
oh my god I missed this well that does it for the traffic data https://t.co/mV8QxIKJpV