🧵 View Thread
🧵 Thread (9 tweets)

In the field of "network geometry" there is a totally different approach. The observed edges in the graph are considered to be generated from an underlying process which corresponds to a (hyperbolic) geometry. The idea is to try to infer that underlying geometry.
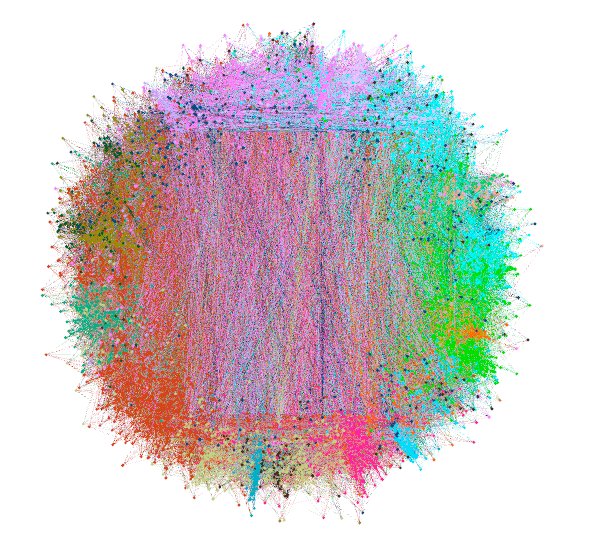
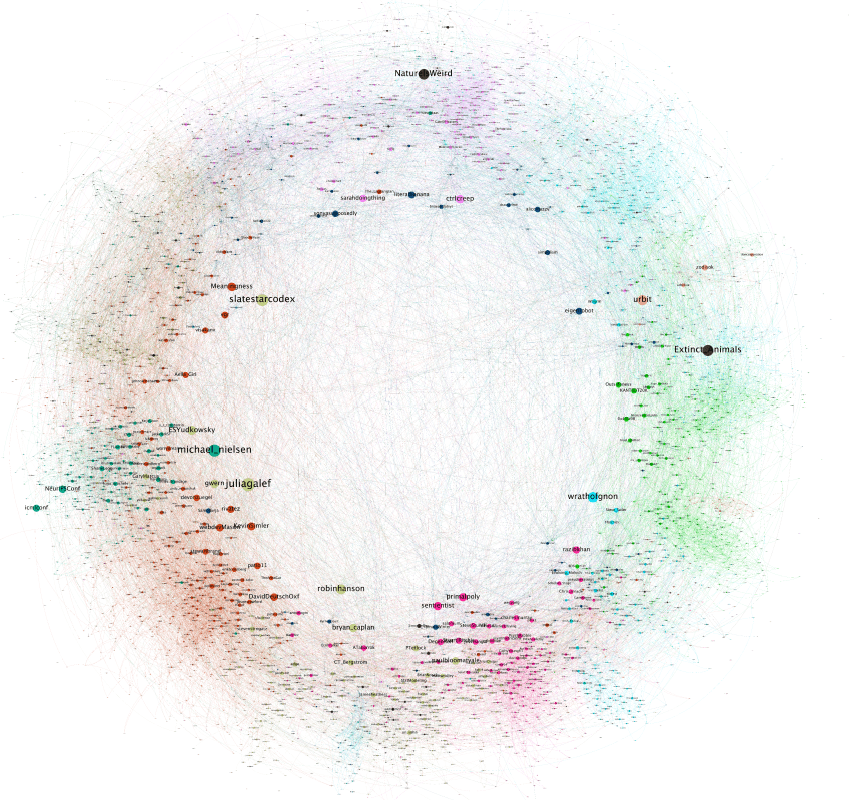
I thought it would be fun to try out this hyperbolic layout inference on the rats graph. If you want to see the result now, here it is Full res (too big for Twitter): https://t.co/YlOmQ0TNvg https://t.co/sTDxPBXOdV
I used this method for the inference https://t.co/iTw23Bdb7c https://t.co/w2oY0ejrfJ Thank you @all_are
The colors in these correspond to levels 0-3 in the N-SBM. (Colors aren't consistent between images). Notice how in every image colors tend to cluster at similar angulars. At the more granular levels this become obvious. It's interesting to notice deviations. https://t.co/ltFrK6HVqj
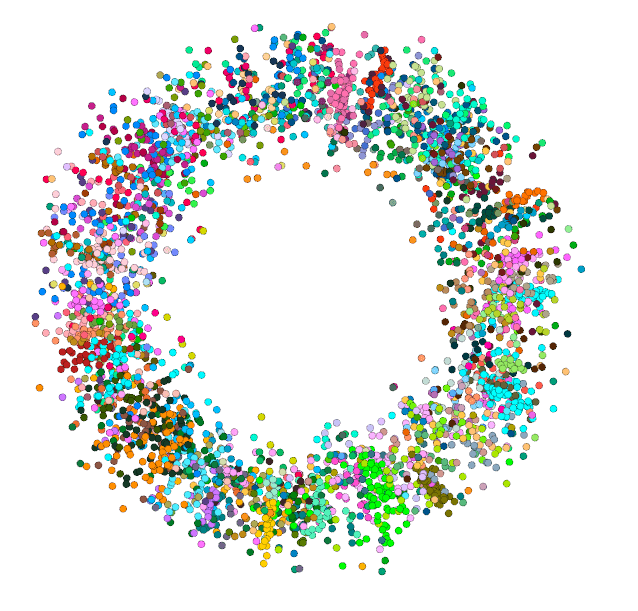
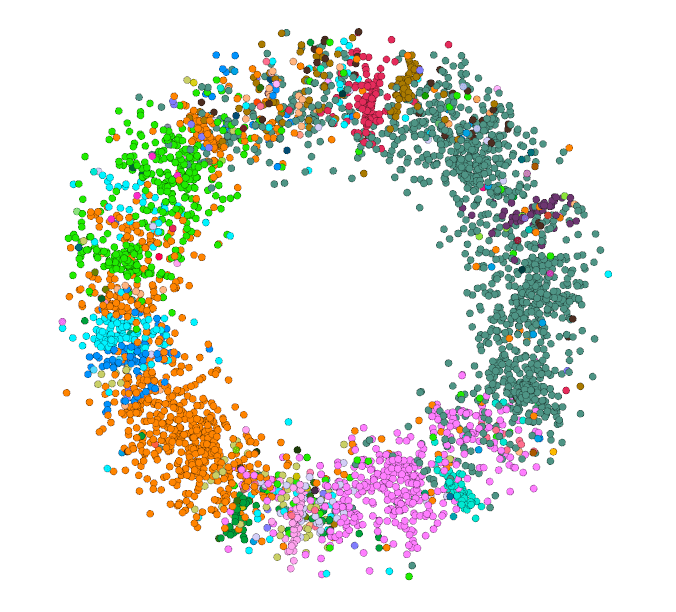
I also wanted to see where the modules inferred by Infomap @m_rosvall would end up on this Left image is the Infomap modules. Right image is the N-SBM level 2 blocks. (colors don't correspond). You can see there is a lot of agreement https://t.co/T3HkhCbKxY
Also, this seems like a good opportunity to show how edge sparsification can help with "hairballs" In the following, 100%, 50%, 20%, 5% of edges are left over after sparsification using Local Quadrilateral Simmelian score as the filter from https://t.co/vvVYchk0WG https://t.co/SY6RjBaFbW